
Chief financial officer's review
Successful margin improvement
Tiger Brands reported a relatively strong set of results driven by revenue growth of 2% to R31,3 billion and 11% operating income growth, before IFRS 2 charges, to R4,6 billion. Operating margins increased to 14,8%.

Cash generated from operations rose 43% to R6,1 billion, benefiting from improved working capital management.
This improvement was due to improved pricing strategies enhanced by good procurement and better cost control. Intense competitor pricing activity and declining consumer confidence resulted in volumes decreasing by 3%. Cash generated from operations rose 43% to R6,1 billion, benefiting from improved working capital management. Headline earnings per share increased by 2% driven by the domestic performance and diluted by a disappointing performance from associates and the Deciduous Fruit business.
As previously reported, the disposal of East Africa Tiger Brands Industries (Ethiopia) was concluded, effective 4 April 2017 while all suspensive conditions have been fulfilled with regards to the disposal of Haco.
Consequently, both have been treated as discontinued operations in these results, with the comparative information restated accordingly.
Analysis of financial performance
The following review of the group’s financial performance should be read together with the annual financial statements (www.tigerbrands.com).
Income statement
Group revenue growth from continuing operations increased by 2%. The revenue performance in the second half is indicative of a significant slowdown in the rate of price increases, due largely to declining commodity prices and a stronger rand. Gross margins benefited from improved pricing and procurement strategies, which helped offset other inflationary increases in raw material costs. Well-controlled conversion costs and efficiency enhancements contributed to further positive leverage in gross margins.
Group revenue growth
| R30,6 billion | 7% price/mix | (3%) volume | (2%) forex | R31,3 billion | ||||||||||
| Total growth |
Price/ mix |
Total volume |
Forex | |||||||||||
| Domestic operations | 4% | 7% | (3%) | – | ||||||||||
| International (including exports) | (5%) | 7% | (3%) | (9%) | ||||||||||
| Total continuing operations | 2% | 7% | (3%) | (2%) | ||||||||||
| FY16 | FY17 | |||||||||||||
During the year, investments, goodwill and intangible assets totalling R560 million (2016: R335 million) were impaired. This related mainly to an impairment of the goodwill in the Exports division of R300 million, and an impairment of R250 million against the investment in Nigerian associate, UAC Foods. These impairments reflect the continual assessment of risks associated with these businesses amid ongoing difficulties faced across our key markets in Africa. These are primarily the result of deteriorating macro-economic factors, largely linked to falling commodity prices and exacerbated by currency devaluations in Nigeria and Mozambique. In addition, the lack of foreign exchange liquidity required trade credit to be managed tightly, inhibiting revenue growth.
The abnormal loss of R23 million (2016: abnormal gain of R11 million) comprises once-off costs for the recent strategic review and related restructuring provisions, partially offset by the profit on disposal of property as well as income from insurance claim proceeds and certain warranty claims.
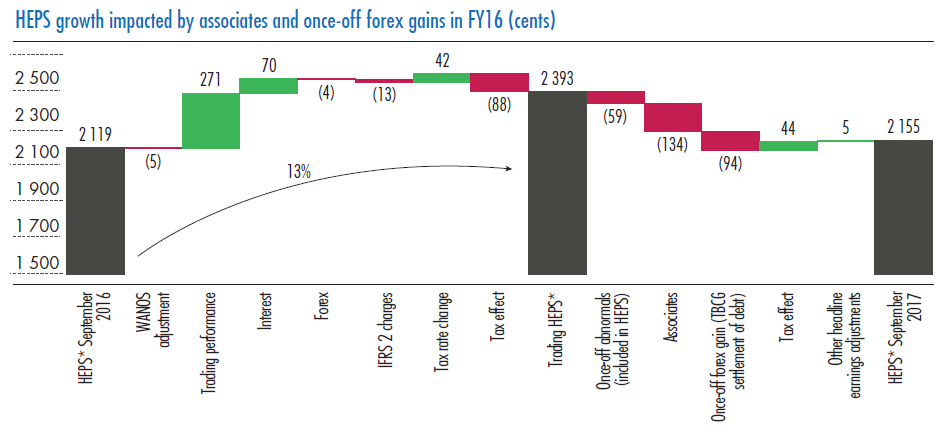
Net financing costs of R207 million (2016: R162 million) benefited from a reduction in interest charges of R117 million to R180 million, due to lower debt levels. A net foreign exchange loss of R30 million was realised compared to a gain of R129 million in the prior year, of which R153 million related to a gain on the settlement of non-recurring debt in Nigeria.
Income from associates decreased 38% to R533 million (2016: R861 million). The comparative period included capital profits of R117 million from asset disposals. After adjusting for this, associate headline earnings decreased by 29%. This reflects challenging operating conditions for Oceana, in particular, as well as Carozzí and UAC Foods.
A 2% improvement in the effective tax rate before abnormal items, impairments and associates, to 28,9% (2016: 30,9%) was largely due to investment allowances received on qualifying major capital projects.
HEPS from continuing operations was up 2% to 2 155 cents (2016: 2 119 cents). The deleverage between operating income growth of 11% and HEPS growth of 2% primarily reflects a significantly lower contribution from associates, costs associated with the strategic review and related restructuring provisions as well as the once-off forex gain in the prior year.
Earnings per share (EPS) from continuing operations decreased 7% to 1 848 cents (2016: 1 996 cents), driven primarily by higher impairments in the current year.
EPS from total operations decreased by 6% to 1 915 cents (2016: 2 034 cents), while HEPS from total operations increased 2% to 2 161 cents.
* From continuing operations.
Segmental performance
The domestic business delivered operating income growth of 15% while an improved performance from Exports and International was offset by Deciduous Fruit.
| Grains | Consumer Brands Food |
HPCB | Exports and International |
Group* | ||||||
| Volume |  1% |
 9% |
2% |
3% |
3% |
|||||
| Turnover | R13,3bn | R11,1bn | R2,7bn | R4,2bn | R31,3bn | |||||
| 5% |
1% |
9% |
5% |
2% |
||||||
| Operating income** | R2,4bn | R1,3bn | R0,6bn | R0,4bn | R4,6bn | |||||
| 18% |
7% |
17% |
20% |
11% |
||||||
| Operating margin** | 17,7% |
11,5% |
23,5% |
9,5% |
14,8% |
* From continuing operations.
** Before IFRS 2 charges, impairments and abnormal items.
Revenue in the domestic business increased 4% to R27,1 billion (2016: R26,2 billion), driven primarily by Grains and Groceries. Operating income before IFRS 2 charges grew 15% to R4,2 billion (2016: R3,7 billion), while the operating margin increased from 14,1% to 15,6%. The deteriorating economic environment continued to put pressure on consumer demand, resulting in volume contraction of 3%.
The group’s overall operating performance was impacted by the underperformance of the Exports and International division. Revenue for this division was down 5% to R4,2 billion while operating income declined 20% to R399 million, driven primarily by the Deciduous Fruit business where performance was severely impacted by the stronger rand. Although the Export business continued to face a challenging environment, with no improvement in foreign currency liquidity, trading improved in the second half of the year and core markets benefited from improved distribution and product availability.
Detailed segmental disclosures appear in the annual financial statements and operational reviews.
Statement of financial position
Improved cash generation resulted in a positive net cash position of R431 million at 30 September 2017. Cash generated from operations increased by 43% to R6,1 billion, benefiting primarily from working capital improvements. Capital expenditure during the year totalled R919 million (2016: R945 million).
Balance sheet positioned for growth
| FY17* | FY16 | |||
|---|---|---|---|---|
| Cash generated from operations (Rm) | 6 056 | 4 233 | ||
| Net cash/(debt) (Rm) | 431 | (2 028) | ||
| Net (cash) debt/ equity (%) | (3) | 13 | ||
| Net debt/EBITDA* | n/a | 0.4x | ||
| RONA (%)* | 35 | 30 | ||
| Net interest cover* | 25x | 14x | ||
| Working capital per R1 of turnover | 21,8 | 23,6 |
* From continuing operations.
The strength of the balance sheet facilitates a significant capital expenditure programme of some R5 billion over the next three to five years while maintaining a dividend cover ratio of 2,0 times, based on headline earnings per share. This programme is focused on enhancing the infrastructure behind our core brands, research and development, and the meaningful innovation that is a key differentiator in our competitive industry. In addition, our balance sheet enables us to build a pipeline of opportunities intended to support value-enhancing growth.
Final dividend
The company has declared an unchanged gross final cash dividend of 702 cents per share for the year ended 30 September 2017. This, together with the interim dividend of 378 cents per share, brings the total dividend for the year to 1 080 cents. This is 1% above last year’s total dividend of 1 065 cents.
Shareholders are referred to the accompanying dividend announcement for further details, see Declaration of final dividend number.
Outlook
The economic outlook for 2018 is muted, with no current signs of a recovery in consumer spending and growth levels likely to remain low. As such, there is little likelihood of volume uplift in the year ahead and competition for market share is expected to intensify.
Having largely been successful in enhancing margins, the group is well positioned to navigate this environment and pursue volume growth. This will be achieved by improving our market shares through enhanced and focused brand support, a re-energised approach to innovation focused on the consumer, and by investing in and growing with our customers. We will continue to focus on driving efficiencies and cost savings to provide the fuel for our growth.
Acknowledgements
Thank you to our local and international shareholders for your continued investment in our group and to members of the broader investment community for their interest and engagement. I also thank my colleagues in the finance department who constantly strive to ensure the group achieves best practice standards in reporting and disclosure.
Noel Doyle
Chief financial officer
28 November 2017