
Chief financial officer's review
Despite a challenging operating environment, our resilient brands drove strong volume growth, particularly in the domestic market with total group turnover from continuing operations up 11% to R31,7 billion while operating income* was up 5% to R4,2 billion.
| * Before impairment, abnormal items and IFRS 2 charges |
 |
Introduction
The year under review was characterised by an unpredictable external environment. Consumer confidence remained weak, resulting in competition intensifying as retailers and manufacturers continued to compete for their share of constrained consumer spending. In addition, the prolonged drought and significant currency volatility led to high inflation in raw material input costs. The impact of this was felt across the domestic portfolio, most notably in the Grains and Groceries divisions. The operating environment is discussed in more detail on pages 26 and 27 of this report.
Analysis of financial performance
The following review of the group’s financial performance should be read together with the annual financial statements.
Income statement
Notwithstanding a challenging operating environment, our resilient brands drove strong volume growth, particularly in the domestic market, with total group turnover from continuing operations increasing by 11% to R31,7 billion (2015: R28,7 billion), while operating income before IFRS 2 charges increased by 5% to R4,2 billion (2015: R4,1 billion). Despite a marginal decline in the Grains division’s operating income, driven primarily by drought-related cost increases in maize and sorghum, the performance of the balance of the domestic portfolio reflects the strength of our brands, with particularly strong performances from Groceries, Beverages and Home Care. The overall operating margin before IFRS 2 charges declined to 13,4% from 14,1% influenced by responsible pricing to protect our brand franchises.
Income from associates rose 43% to R861 million, driven primarily by Oceana Group and Chile-based Empresas Carozzí. The contribution from associates includes capital profits of R117 million (2015: R3 million) after certain asset disposals.
The 13% reduction in net financing costs resulted from a net foreign gain of R121 million (2015: R21 million), including a once-off foreign exchange gain of R153 million, following the settlement of a naira-denominated loan assumed as part of the exit from Tiger Brands Consumer Goods plc (TBCG), partly offset by the impact of higher domestic interest rates in the current year.
 Profit before tax from continuing operations increased by
10% to R4,5 billion (2015: R4,1 billion), after accounting
for R335 million in impairment charges. These impairments
related primarily to goodwill and other intangible assets in
the Personal Care business.
A higher effective tax rate (before abnormal items and associate income) of 30,9% (2015: 25,6%) resulted in attributable earnings from continuing operations rising by 4% to R3,3 billion.
The group’s interest in TBCG, formerly Dangote Flour Mills, was disposed of with effect from 25 February 2016. Consequently, TBCG has been treated as a discontinued operation in these results, and comparative information restated accordingly.
Earnings per share from continuing operations increased 4% to 2 007 cents (2015: 1 930 cents), while headline earnings per share from continuing operations rose 2% to 2 130 cents (2015: 2 091 cents).
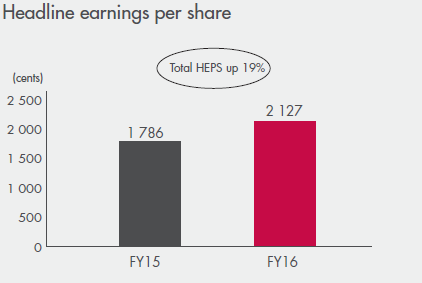
Total earnings per share, including discontinued operations (TBCG), increased 90% to 2 034 cents (2015: 1 068 cents). Total headline earnings per share, including discontinued operations (TBCG), increased by 19% to 2 127 cents (2015: 1 786 cents).
Segmental performance
Domestic operations
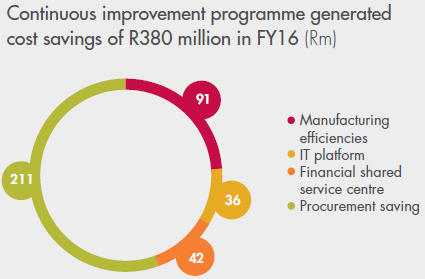 Turnover rose by 11%, driven by volume growth of 2% and
price inflation of 9%. However, operating income grew at
a slower rate of 3% to R3,7 billion. Strong growth in
operating income was recorded by Groceries, Beverages
and Home Care, with a marginal decline in the Grains
division’s performance, driven largely by a significant
reduction in the profitability of the maize business. Ongoing
cost management programmes have proven successful, with
savings of R380 million during the year. However, these
savings, coupled with higher realisations, were insufficient
to counter inflationary pressures in soft commodities.
Consequently, the overall domestic operating margin
declined from 15,2% to 14,0%.
International (including Exports)
Total turnover rose 7% to R5,4 billion (2015: R5,0 billion), while operating income increased by 19% to R547 million (2015: R462 million). The operating margin widened from 9,2% to 10,2%. Overall volumes decreased by 5% as a result of the significantly lower volumes recorded by the Exports division. Exports’ performance was impacted by currency devaluations and foreign exchange shortages in major export regions including Nigeria, Mozambique, Zimbabwe and Zambia. This in turn affected the ability of key customers to stay within their credit limits and replenish stocks. In addition, import permit regulations imposed in Zimbabwe significantly impacted performance in the fourth quarter.
Detailed segmental disclosures appear on pages 35 and 36 and operational reviews on pages 40 to 51.
Statement of financial position
| Key ratios | 2016* | 2015 | ||||
|---|---|---|---|---|---|---|
| Cash generated from operations (Rm) | 4 233 | 3 585 | ||||
| Net (debt)/cash (Rm) | (2 028) | (3 788) | ||||
| Net debt/equity (%) | 13 | 28 | ||||
| Net debt/EBITDA (x) | 0,4 | 0,8 | ||||
| Return on net assets (%) | 31 | 26 | ||||
| Net interest cover (times) | 14 | 18* |
| * From continuing operations |
Tiger Brands’ net debt decreased by R1,8 billion, benefiting largely from the disposal of TBCG. The net debt to EBITDA ratio decreased to 0,4 times (2015: 0,8 times), well within the group’s covenant limit of 2,5 times. The strength of the balance sheet allows the company to take advantage of opportunities that may arise.
 Cash flow and capital expenditure
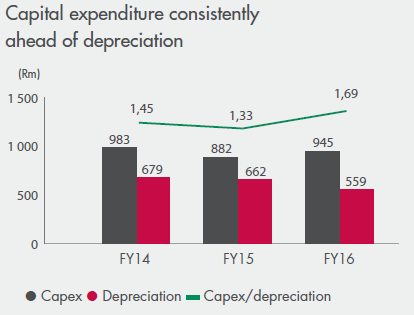
Cash generated from operations increased 18% to R4,2 billion (2015: R3,6 billion). The improvement was primarily due to the disposal of TBCG in February 2016. Capital expenditure during the year was R945 million (2015: R882 million). Net debt for the group was reduced by R1,8 billion also benefiting largely from the disposal of TBCG.
Capital expenditure has consistently been ahead of depreciation and future investment will target growth, efficiency and flexibility. An amount of R1,9 billion has been budgeted for FY17.
Final dividend
The company has declared a final dividend of 702 cents per share (2015: 611 cents) for the year ended 30 September 2016. This, together with the interim dividend of 363 cents per share, brings the total dividend for the year to 1 065 cents. This is 12% higher than last year’s total dividend of 950 cents.
Outlook
The difficult trading environment is expected to persist with inflation levels remaining high. The anticipated benefit of lower soft commodity prices is only likely to be felt in the latter part of the ensuing financial year.
Given the solid performance in 2016, Tiger Brands is well positioned to counter potential headwinds. The focus will be on optimising margins without sacrificing market share. Our leading positions will be supported with accretive innovation, while sustaining the strength of our brands through targeted investment. As input cost inflation is expected to persist, cost-saving initiatives will receive renewed and more assertive focus to drive profitability. The creation of a high-performance culture will underpin our efforts.
Acknowledgements
Thank you to our local and international shareholders for your continued investment in our group and to members of the broader investment community for their interest and engagement. I also thank my colleagues in the finance department who constantly strive to ensure the group achieves best practice standards in reporting and disclosure.
Noel Doyle
Chief financial officer
22 November 2016