
Remuneration report
Section 1: Background statement

STATEMENT FROM THE CHAIRMAN OF THE REMUNERATION COMMITTEE
DEAR STAKEHOLDER
On behalf of the remuneration committee (the committee), I am pleased to present the 2019 remuneration report which, in compliance with best practice reporting as recommended by the King IV™ Report on Corporate Governance for South Africa (King IV™ Code for Corporate Governance), highlights:
- Key components of our remuneration policy
- Alignment of our remuneration policy with the Tiger Brands business strategy and priorities
- Implementation of the policy for the 2019 financial year (FY19)
During the period under review we focused our efforts on ramping up the execution of our four strategic priorities:
- Drive Growth: Winning category, channel and customer strategies.
- Be Efficient: Cost-conscious and an integrated supply chain.
- Great People: A winning mindset and great place to work.
- Sustainable Future: Health and nutrition, enhanced livelihoods and environmental stewardship.
The focus on these priorities is placing the company in a better position to react appropriately to prevailing market conditions.
During the period under review, various changes were made to the remuneration strategy and policy to align with market practices and drive further alignment on critical business key performance indicators (KPIs) to measure and reward performance against our strategy. To this end, the remuneration committee approved the implementation of a revised short-term incentive (STI) scorecard that creates a balance between the focus on financial and sustainability measures and a move from the allocation of share appreciation rights (SARs) to the allocation of full value shares with performance conditions for members of the executive committee, including the CEO, CFO, executive directors, prescribed officers and a combination of performance shares and restricted shares for senior management and below, to ensure that the long-term incentive scheme (LTI) remains competitive. This revised incentive structure is simple, easily understood by participants and creates a better and longer-term alignment of management’s interests with that of stakeholders. The new incentive structure enhances our reward framework, which follows a “Total Reward” approach, consisting of salary, a range of market relevant benefits and professional growth opportunities that recognise individual contributions, as well as performance. This holistic approach enables us to attract, motivate and retain high-performing people (see further details in Section 2).
SHAREHOLDER VOTING OUTCOMES
In line with our commitment to remunerate our people in a fair and equitable manner, we maintain strong relationships with stakeholders, and strive towards high standards of disclosure of our remuneration approach to ensure that there is a clear understanding of our remuneration policy and the practices that have been implemented.
The non-binding advisory votes by shareholders at the 2019 and 2018 annual general meetings (AGM) are summarised as follows:
| % vote in favour | February 2019 |
February 2018 |
||
|---|---|---|---|---|
| Remuneration policy | 76,33% | 73,41% | ||
| Remuneration implementation | 99,42% | 82,59% | ||
| Non-executive directors’ fees | 97,45% | 99,80% |
The following common themes were highlighted by shareholders:
| SHAREHOLDER FEEDBACK | REMUNERATION COMMITTEE ACTION/RESPONSE | |
| Matching plans are considered contrary to best practice especially if awarded without specific performance criteria. | Deferred bonus shares and company matching shares will be discontinued from FY20. | |
| The vesting scale for Share Appreciation Rights (SARs) does not include sufficient stretch. | The long-term incentive scheme design does not include SARs as an instrument from FY20. Performance vesting shares will be awarded to members of the executive committee, with revised vesting conditions. The revised vesting conditions are broad enough to create a balance between entry and stretch targets on the vesting scale. Details below. | |
| Non-executive directors are paid hourly fees for extra work and additional meetings attended. This may affect their ability to function independently. | The payment of hourly fees was discontinued with effect from 1 October 2018. The payment of NED fees for additional meetings over and above the standard meetings, will only be permitted at the discretion of the chairman of the remuneration committee and chairman of the board. Detailed disclosure on additional payments, if made, to be included in the remuneration report. |
SHAREHOLDER ENGAGEMENT
The remuneration committee is committed to shareholder engagement and will take the following steps if 25% or more of total votes exercised by shareholders at the upcoming AGM are against the remuneration policy or implementation report:
- Tiger Brands will seek to actively engage with dissenting shareholders by inviting them to one-on-one meetings and, where necessary, will issue a SENS announcement requesting shareholders to appropriately engage on their specific concerns; and
- Tiger Brands will consider the shareholder concerns and report on the outcome of the engagements and measures taken, in its next integrated report.
REMUNERATION COMMITTEE OBJECTIVES AND ACTIVITIES FOR FY19
In FY19 the committee undertook the following activities:
- Approved total remuneration packages (TRP) salary increase mandate;
- Approved the remuneration for executive directors, prescribed officers and senior management;
- Approved the redesign of the STI scorecard and LTI instruments;
- Approved the STI and LTI performance conditions, targets and weightings in respect of FY19/20;
- Approved the adjustments to LTIs as a consequence of the unbundling of Oceana;
- Approved the non-executive directors’ (NEDs) fee increases; and
- Re-evaluated the effectiveness of the current BBBEE share scheme.
FOCUS AREAS FOR FY20
The committee is committed to remaining up to date with the latest remuneration market trends and best practice, business needs, as well as our responsibilities to our people, shareholders and communities to ensure that our remuneration practices are aligned to the business strategy.
Key focus areas include:
- Embed the STI integrated scorecard to align our people with business objectives;
- Cement and refine our approach to monitor and address identified pay inequities;
- Continue to review our reward mechanisms and practices with a view to introducing innovative reward strategies to:
✓ Ignite winning performance; and
✓ Attract, retain and motivate key talent.
EXTERNAL ADVICE PROVIDED TO THE COMMITTEE IN FY19
In reviewing our remuneration offering to ensure that it is competitive, fair, transparent and responsible, we enlisted the services of PwC South Africa and Vasdex Associates to assist us with design, market practice and survey data. The committee is satisfied that PwC South Africa and Vasdex Associates are independent.
VOTING AT AGM
As required by the King IV Code on Corporate Governance, the remuneration policy and implementation report which follows will be tabled for separate non-binding advisory votes by shareholders at the upcoming AGM. As required by the Companies Act, non-executive directors’ fees for the coming year will be put to shareholders by way of a special resolution. We encourage all shareholders to provide feedback on their position on the various voting requirements. We are committed to engaging with shareholders as required to discuss issues of concern.
On behalf of the committee, I am confident that our remuneration policy has achieved the desired outcomes for FY2019 and is aligned with the company’s strategic goals.
Mark Bowman
Chairman – Remuneration committee
4 November 2019
Section 2: Overview of remuneration policy
TIGER BRANDS PEOPLE STRATEGY
The remuneration strategy is aligned to the Tiger Brands people strategy, which is directly linked to our business strategy and it combines the three pillars of TALENT, LEADERSHIP AND GREAT PLACE TO WORK underpinned by the foundation of EXECUTION EXCELLENCE. Our remuneration principles have been designed to drive the execution of the people strategy, in the belief that great people and great brands are at the core of our success. Our reward framework is holistic, encompassing the monetary elements of reward, as well as non-financial aspects such as growth, development and the work environment.
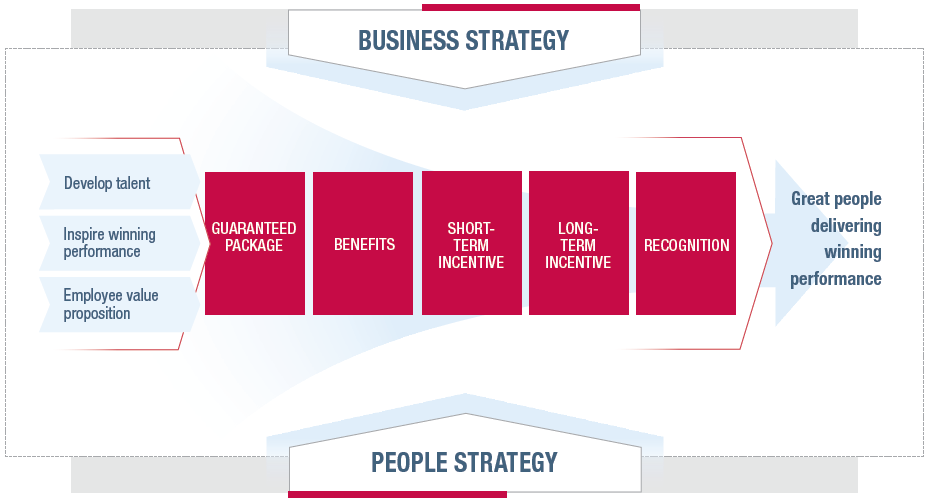
The following key objectives of our remuneration policy drive the Tiger Brands people strategy:
- Strengthen our ability to competitively attract and retain talent to enable the execution of our strategy;
- Align Tiger Brands’ annual and long-term performance to the delivery of the strategy;
- Align Tiger Brands’ people performance with shareholder interests;
- Motivate and stimulate high performance across Tiger Brands through competitive short and long-term incentives;
- Cement the foundation for fair and responsible pay we have already built; and
- Ensure that reward mechanisms are simple and provide line of sight to all employees.
The following tables summarise the various remuneration elements (guaranteed package, short-term incentive and long-term incentive) that Tiger Brands offers at different levels of employment:
GUARANTEED PACKAGE (EXCLUDING BARGAINING UNIT PEOPLE)
Description
Guaranteed package (GP) offered to people on a total remuneration package (TRP) comprises base pay, allowances, retirement and medical benefits. It is reviewed annually based on personal performance (KPIs based on a balanced scorecard that includes financial and non-financial metrics), business performance (linked to budget), behaviours aligned with the company values and market competitiveness (national and sector benchmarks).
Benchmarks
Benchmarking for executive directors and prescribed officers is based on a peer group of companies. The peer group is determined using the closeness metric formula, based on:
| Turnover | Total assets |
| Operating income before tax | EBITDA |
| Number of people | Market capitalisation |
Companies included in the peer group comprise:
| Factor | Executive directors and prescribed officers | Rest of exco, senior management and below | ||||||||||||||
| Survey type | Bespoke survey Public data of South African companies listed on the JSE, based on the closeness metric is used to determine an appropriate peer group |
REMchannel survey | ||||||||||||||
| Comparator group |
|
National and consumer goods circles |
The peer group is reviewed on a bi-annual basis.
| Anchor point | Tiger Brands has anchored its current pay position at the 65th percentile of the national market, where a normal distribution around the anchor point is based on individual performance, talent/potential, experience and in certain instances, tenure. It is important to note that guaranteed packages are not automatically adjusted to the anchor point. The performance-based increases granted in the organisation (including those for executive directors and prescribed officers) are managed within the overall salary increase budget and the pay progression model as discussed below. | |
| Benefits | Benefits include retirement fund contributions, funeral cover, permanent health insurance, death-in-service cover, medical aid contributions and travel allowances (where applicable). | |
| Pay progression model | The intention of the pay progression model is to competitively reward performance and to actively align our remuneration to the market. The pay progression model will, gradually over time and within the confines of our salary increase budget, correct the guaranteed packages for high-performing people to align them closer to the market. The model considers the employee’s salary positioning in relation to the pay scale as well as performance when granting an increase whilst ensuring that the company remains within the overall salary budget. |
SHORT-TERM INCENTIVE
Description and link to strategy
In FY17, we revised the operating model for Tiger Brands to help maximise the potential of our people in line with our business goals. To ensure that our reward approach is aligned with our integrated operating model, we have revised and simplified the STI scheme to align the contributions of all our people to a One Team Tiger bottom line, thereby creating greater potential for reward across the board. The STI scheme is summarised below.
Summary of changes for FY19
- STI formula change – to drive performance and ensure retention, the company has moved away from the multiplicative approach, which was an “all or nothing” approach, to an additive approach that provides participants with an opportunity to earn the STI based on individual elements (financial and non-financial) of performance delivered. To improve line of sight between individual contribution, team and business performance, the STI scheme now includes an Individual Performance Factor at a weighting of 20%;
- Inclusion of an integrated group STI scorecard for the whole of Tiger Brands with a greater focus on sustainability measures to align teams on a One Tiger bottom line; and
- Revision of group, business unit and individual performance factors and weightings.
The primary intention of the STI is to improve business performance by focusing participants’ attention on key financial, strategic, functional and personal performance objectives (KPIs based on a balanced scorecard), which are aligned with the long-term business strategy for sustainable value creation. This drives high performance by explicitly creating line of sight in linking group, business unit and individual performance.
- All permanent employees on a guaranteed package in Paterson grades CU and above, are eligible to participate. Previously CU employees were not eligible to participate; however, to better align our people and motivate winning performance, we have included this group in the STI.
- The STI is paid annually in cash to qualifying people who are employed by the organisation on the payment date.
- The on-target percentage (as a percentage of guaranteed package) is benchmarked against the South African market to ensure we are aligned with market practice. It is based on affordability and the STI payment is based on achieving the defined objectives.
- The STI outcomes are determined based on a multiple
of the on-target percentage of guaranteed package,
which comprises three performance factors:
✓ A group performance factor focused on group financial and non-financial metrics.
✓ A business unit performance factor focused on business unit financial and non-financial metrics.
✓ An individual performance factor focused on individual performance objectives and allows for differentiation in rewarding high performers.
Payment of an STI is subject to the overriding condition that the group/business unit meets or exceeds the agreed entry threshold in respect of its earnings before interest and tax (EBIT).
Calculation
STI = Annual guaranteed package X on target % X {group performance factor (0 to 200%) + business unit performance factor (0 to 200%) + Individual Performance Factor (0 to 200%).
Predetermined weightings will be applied to each of the performance factors. In respect of the Individual Performance Factor, participants will be rated on a rating scale ranging from 1 (poor performer) to 5 (exceptional performer).
Target and maximum
The following ranges of STI awards apply to the various categories of people covered by this report:
| On-target guaranteed package % |
Maximum of on-target amount % |
||||
| CEO, CFO and executive directors | 60 | 200 | |||
| Prescribed officers | 50 | 200 | |||
| Other participants (Paterson grades CU to E band) | 8,5 to 30 | 200 |
Group and business unit performance factors
The underlying values and weightings for each KPI are set and approved by the remuneration committee in advance of each year to determine parameters for the STI in the form of a balanced scorecard. Below is the group STI scorecard for FY19 that applied to the CEO, CFO, executive directors, prescribed officers and other participants:
| Strategic objective |
Strategic objective weighting |
Key performance indicator |
Key performance indicator weighting |
Score = 50% | Score = 100% | Score = 200% | ||
| Growth*,** | 60% | Sales volume growth | 10% | 40,0% | 100,0% | 140,0% | ||
| Absolute gross margin | 10% | 98,6% | 100,0% | 103,6% | ||||
| PBIT | 40% | 98,6% | 100,0% | 103,6% | ||||
| Efficiency*,** | 10% | Cost savings initiatives | 5% | 98,6% | 100,0% | 123,4% | ||
| Net working capital | 5% | 101,2% | 100,0% | 97,7% | ||||
| People and sustainability* | 10% | Reduction in execution-related marketplace incidents year-on-year by | ||||||
| 30% | Quality | 10% | 15% | 20% | ||||
| Safety (LTIFR) | 10% | 120,0% | 100,0% | 80,0% | ||||
| BBBEE score | 10% | Level 7 (60 to 61) | Level 7 (61.1 to 65) | Level 6 | ||||
| * | The actual targets have not been provided as they are linked to budget and considered commercially sensitive information. |
| ** | For the key performance indicators within the growth and efficiency strategic objectives, the targeted percentages for “threshold”, “on-target” and “stretch” as set out above per key performance indicator represent the targeted percentage achievement of the underlying budgeted amounts. |
The group, business unit and individual weightings applicable to the various employee categories are detailed below:
| Employee category | Group | Business unit | Individual | |
| CEO, CFO and executive directors | 80% | 0% | 20% | |
| Prescribed | 80% | 0% | 20% | |
| Other participants (Paterson grades CU to E band) | 10% to 40% | 40% to 70% | 20% |
LONG-TERM INCENTIVE – MANAGEMENT (PATERSON GRADE D AND ABOVE)
Description
To ensure that we align our reward approach to our integrated operating model, we have revised and simplified the LTI for FY20 to consider the following:
- Strengthen our ability to competitively attract and retain talent to enable the execution of our business strategy; and
- Align Tiger Brands’ management’s performance to our long-term strategy and, in particular, to unleashing the power of our people objective.
The original Tiger Brands 2013 Share Plan (LTIP) comprised the following instruments:
- Performance vesting shares (full value shares with a three-year vesting period, performance vesting criteria linked to the FINDI 30 Index in terms of shareholder return)
- Restricted shares issued as bonus-matching shares (full value shares with a three-year vesting period, no performance criteria)
- Restricted shares issued as deferred bonus shares and company-matching shares (full value shares with a three-year vesting period, no performance criteria)
- Restricted shares as retention specific shares for African, Coloured and Indian (ACI) employees in D band and above (full value shares with a three-year vesting period, no performance criteria)
- Share appreciation rights (SARs).
The allocations of SARs were subject to performance vesting criteria. Apart from a 5% vesting of the third tranche of SARs allocated in FY14, all the tranches of SARs allocated in subsequent financial years that would have vested in FY19 have been forfeited due to performance criteria not having been met. Any continuation of this trend is of concern to the company as the mechanism is ineffective in providing key people with a vested interest in the company.
In mitigation of this risk, the committee approved the reintroduction of the award of performance shares, ie full value shares that are subject to performance conditions, with effect from FY20. At the same time, the company will also commence with the grant of restricted shares on a “specific retention basis”. The allocation of SARs will thus be discontinued going forward.
The practice of the grant of restricted shares in the form of “bonus-matching shares” (which were linked directly to the achievement of an STI in the previous financial year) will be discontinued as from FY20. In addition, as from FY20, the voluntary deferral of a portion (25%, 33% or 50%) of participants’ STI awards into restricted shares (“deferred bonus shares”) which are matched by the company on a 1:1 basis in the form of “company-matching shares” will be discontinued (due to shareholders raising best practice concerns and a historical low uptake from participants). All previous grants of bonus-matching shares, deferred bonus shares and company-matching shares will continue to vest in accordance with the rules of the LTIP.
Below is a description of the share instruments utilised in FY19
Share Appreciation Rights
The last grant of Share Appreciation Rights was made on 5 June 2019. The following multiples of Share Appreciation Rights, based on guaranteed package, applied to the employee categories shown below:
Value of awards
| Employee category | % of guaranteed package |
|
| CEO | 120% | |
| CFO | 120% | |
| Prescribed officers and executive directors | 110% |
Calculation
The number of SARs at allocation date is determined as follows: SARs = (GP x SARs multiple/share price) x PDT multiplier. A performance differentiation tool (PDT) is used to modify the standard quantum of SARs, based on an individual’s personal performance, leadership and ability. This is a discretionary percentage ranging from 0% to 200%.
Share price
The share price is determined based on the volume-weighted average price (VWAP) of a Tiger Brands share for the 10 trading days before the allocation date.
Vesting
In addition to meeting the required performance conditions, vesting is time-based according to the following pattern:
| Year from allocation date | |||||||
| 0 | 1 | 2 | 3 | 4 | 5 | ||
| Vesting | 1/3 | 1/3 | 1/3 | ||||
Performance metrics
The allocations of SARs during the 2019 financial year are subject to the performance criteria as set out in the table below:
| Metric | Measurement | Weight | Metric | |||
| HEPS (real HEPS growth) | Compound annual growth | 50% | Full vesting: HEPS = > CPI + rate of growth in GDP (measured on an annual compound basis over the applicable period) Pro rata vesting on a linear scale: HEPS growth > CPI but below CPI + GDP rate. No vesting if HEPS < = CPI | |||
| ROIC | Average ROIC measured over three, four and five years for each one-third tranche |
50% | ROIC < WACC +1% | No vesting | ||
| ROIC = WACC +1% | 25% vesting | |||||
| ROIC > WACC +1% but < WACC +2% | Pro rata vesting on a linear scale | |||||
| ROIC => WACC +2% | 100% vesting | |||||
HEPS: Headline earnings per share
ROIC: Return on invested capital (after tax)
For SARs allocated in December 2016, September 2017 and December 2017, the performance vesting condition is as follows:
| Metric | Weight | 0% vesting | Maximum 100% vesting |
|
| HEPS | 100% | CPI and below | CPI +GDP |
Pro rata vesting on a linear scale of HEPS growth >CPI but below CPI + GDP rate. Further vesting condition: Average annual return on capital over the relevant performance period must exceed the company’s weighted average cost of capital (WACC).
Bonus-matching shares
The last grant of bonus-matching shares was made in December 2018. The following multiples of bonus-matching shares, based on the face value of the STI award, applied to the employee categories covered by this section.
Value of awards
| Employee category | % of STI earned (face value) |
|
| CEO | 50% | |
| CFO | 50% | |
| Prescribed officers | 50% |
Calculation
The number of bonus-matching shares at grant date is determined as follows: Bonus-matching shares = (actual STI x 50%/share price) x PDT multiplier. The performance differentiation tool (PDT) is used to modify the standard quantum of bonus-matching shares based on an individual’s personal performance, leadership and ability. This is a discretionary percentage ranging from 0% to 200%. No bonus-matching shares are awarded if no STI is earned.
Share price
The share price is determined based on the VWAP of a Tiger Brands share for the 10 trading days before the grant date.
Vesting
Vesting takes place on the third anniversary of the date of grant:
| Year from grant date | |||||||
| 0 | 1 | 2 | 3 | 4 | 5 | ||
| Vesting | 100% | ||||||
Performance metrics
There are no further performance conditions to determine vesting, which is therefore time-based. The reason for no further vesting conditions is that the quantum of bonusmatching shares is directly linked to the achievement of a STI. Performance is, therefore, determined “on the way in”. The executive directors and prescribed officers did not meet their STI targets in FY18 and therefore did not qualify for STIs. No bonus-matching shares were, therefore, granted to executive directors and prescribed officers in FY19.
Deferred bonus shares and company-matching shares
Previously the CEO, CFO, executive directors, prescribed officers and members of the executive team could voluntarily defer a portion (25%, 33% or 50%) of their STI into deferred bonus shares, which were then matched by the company on a 1:1 basis.
Value of awards
Deferred bonus shares and company-matching shares could only be granted if a bonus/STI was earned. Hence performance is “on the way in”.
Calculation
The number of deferred bonus shares and company-matching shares, at grant date, is determined as: Deferred bonus shares and company-matching shares = (actual STI deferred x 2/share price). If no bonus is earned or a participant elects not to voluntarily defer a portion of their STI, no deferred bonus shares and company-matching shares will be awarded.
Share price
The share price is determined based on the VWAP of a Tiger Brands share for the 10 trading days before the grant date.
Vesting
Vesting of deferred bonus shares and company-matching shares takes place on the third anniversary of the date of grant:
| Year from grant date | |||||||
| 0 | 1 | 2 | 3 | 4 | 5 | ||
| Vesting | 100% | ||||||
Performance metrics
There are no further performance conditions to determine vesting.
The executive directors and prescribed officers did not meet their STI targets in FY18 and, therefore, did not qualify for STIs in December 2018. No deferred bonus shares and company-matching shares were, therefore, granted to executive directors and prescribed officers in FY19. No upward adjustment of other share instruments was implemented to compensate.
Historical LTI information
SARs performance conditions for previous allocations
For SARs allocated before December 2016, the performance vesting conditions are based on a targeted rate of 3% per annum real growth in HEPS over three, four and five-year periods. Percentage threshold levels for real HEPS growth and the corresponding percentage of the allocation to vest are as follows:
| HEPS growth | Vesting outcome | |
| >0% and <0,5% | 5% | |
| ≥0,5% and <1,0% | 10% | |
| ≥1,0% and <1,5% | 16% | |
| ≥1,5% and <2,0% | 27% | |
| ≥2,0% and <2,5% | 44% | |
| ≥2,5% and <3,0% | 75% | |
| ≥3,0% | 100% |
Performance conditions for previous allocations of performance shares
Performance shares vest on the third anniversary of their award, to the extent that the company has met the specified performance criteria over the period, which were determined as the company’s comparative total shareholder return (TSR) relative to constituent members of the FINDI 30 index. If the company’s relative TSR over the three-year period place it in:
- Position 15 out of 30: the targeted number (one-third of maximum number) of performance shares awarded will vest;
- Position 7 or better: the maximum number (three times targeted number) of performance shares awarded will vest;
- Position 23 or worse: all performance shares awarded will be forfeited; and
- Between position 7 and 15, or between 15 and 23: a pro rated number of performance shares will vest.
As far as the awards of performance shares made in February 2016 and May 2016 are concerned, the performance of the company can be summarised as follows:
February 2016 award
The company’s TSR over the three-year period ended February 2019 placed it in 20th position, resulting in a vesting of 37,5% of the performance shares awarded.
May 2016 award
The company’s TSR over the three-year period ended May 2019 placed it in 26th position, resulting in a forfeiture of the award.
BEE shares
The following two schemes were established as part of the company’s black empowerment strategy:
- Tiger Brands Black Managers Trust (BMT I)
✓ Established in 2005 to attract and retain diverse talent. ✓ Rights allocated – Tiger Brands shares. Rights are settled after making the required capital contributions to BMT I. For all rights allocated on or before 31 July 2010, settlement may take place at any time after the initial lock-in period, ie from 1 January 2015. For all rights allocated after 31 July 2010, the lock-in date varies depending on the date of allocation. Periodically, new allocations are made to new joiners and top-up allocations are made to existing participants promoted to higher grades out of shares that may become available as a consequence of forfeitures. - Thusani Trust
✓ Established in 2005 as part of the company’s BEE phase I empowerment initiative. The trust’s resources were enhanced in 2009 under the company’s BEE phase II transaction. ✓ The trust provides bursaries for tertiary education to dependants of permanently employed black people who might not otherwise be able to afford this cost.
Dilution
Under the rules of the Tiger Brands Phantom Cash Option Scheme (replaced by the LTIP), at any point the aggregate number of unexercised phantom options is limited to 10% of the total issued share capital of the company.
At 30 September 2019, aggregate outstanding options under this scheme represented 0,0% (2018: 0,02%) of the company’s issued share capital. The maximum aggregate number of shares that may be acquired by participants under the LTIP and any other share plan may not exceed 5,5 million shares, and for any one participant 550 000 shares. In determining these limits, shares acquired through the JSE and transferred to participants are not considered. At 30 September 2019, the aggregate number of shares that may be acquired by participants under the various schemes was 2 543 551 (2018: 1 898 112), which represents approximately 1,3% of the number of issued ordinary shares. This is in line with JSE regulations.
Changes for FY20
As from FY20, performance shares will be awarded to executive management, prescribed officers, senior management and middle management. Grants of restricted shares (ie specific retention shares) will be made to selected senior management and key people whose contribution has been identified as being critical to achieving Strategy 2022.
The table below provides further details regarding performance and restricted shares:
| INSTRUMENT | PERFORMANCE SHARES | RESTRICTED SHARES | ||||||||||||||||||||||
| Award mechanism |
|
|
||||||||||||||||||||||
| Calculation |
|
|
||||||||||||||||||||||
| Performance multiplier |
|
|||||||||||||||||||||||
| Vesting |
|
|
||||||||||||||||||||||
| Performance conditions applicable to performance shares | HEPS (weighted at 50%):
|
|||||||||||||||||||||||
| The HEPS calculation is performed on an annual
compound basis over the three-year vesting period Linear vesting to apply between threshold and stretch |
||||||||||||||||||||||||
ROIC – (weighted at 50%)
|
||||||||||||||||||||||||
| The measurement will be the average ROIC over the three-year vesting period | ||||||||||||||||||||||||
| Linear vesting to apply between threshold and stretch | ||||||||||||||||||||||||
| Share price |
|
|||||||||||||||||||||||

Minimum shareholding policy
We have a minimum shareholding policy, where senior executives are expected to build up their personal shareholding in the company over a specific period of time. In the case of the CEO, the target is 200% of guaranteed package whilst the target for executive directors, prescribed officers and other members of the executive committee is 100% of guaranteed package. Senior executives who were in service when the policy was adopted in 2016 have six years to build up their shareholding from date of adoption. Senior executives appointed after adoption have six years to build their shareholding from date of appointment. They may use any vesting LTIs or their own resources to acquire these shares.
Current minimum shareholding summary
| Name | Date of engagement | GP* | Number of shares held |
Original value of shares held |
Current value of shares held** |
% of GP | Target % of GP |
Years remaining to meet target |
| LC Mac Dougall | 10 May 2016 | 9 537 728 | 699 | 257 309 | 147 181 | 3 | 200 | 3 |
| NP Doyle | 1 July 2012 | 6 877 238 | 11 750 | 4 106 615 | 2 474 080 | 60 | 100 | 3 |
| P Spies | 1 February 2017 | 5 095 650 | 2 318 | 893 102 | 488 078 | 18 | 100 | 4 |
| Y Maharaj | 1 July 2018 | 5 092 500 | – | – | – | – | 100 | 5 |
| PD Sithole | 1 August 2012 | 5 097 331 | 7 000 | 2 701 072 | 1 473 920 | 53 | 100 | 3 |
* GP as at 30 September 2019.
** Value calculated with reference to the closing price of a Tiger Brands share as at 30 September 2019, ie R210,56.
Clawback and malus
A clawback and malus policy is in place with the intention to minimise risk.
With respect to malus, if the remuneration committee, in consultation with the board and/or any committee of the board, believes that a trigger event has occurred, it has full discretion to reduce, in part or whole, unvested variable remuneration (ie STIs and LTIs) before the end of the vesting or payment period. In the case of clawback, it is the responsibility of the remuneration committee, in consultation with the board and/or any committee of the board, to implement clawback for the whole or portion of vested variable remuneration in the event of a trigger event occurring over a period of three years from the date on which payment was made of such vested variable remuneration. Trigger events include, but are not limited to:
- Material misstatement of financial results;
- Misconduct, incompetence, fraud, dishonesty;
- Negligence or material breach of obligations to the company;
- Deliberate harm to the company’s reputation; and
- Material failure of risk management.
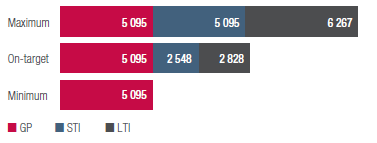
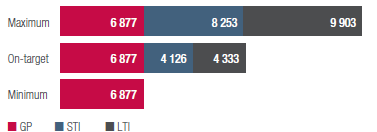
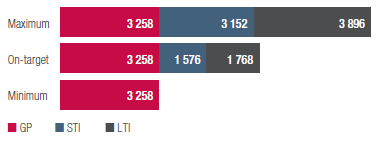
Illustrating potential remuneration outcomes
The variable pay arrangements described above have various potential outcomes. These outcomes could be from zero (minimum) to the expected level of performance outcomes (target) to the maximum potential variable pay outcomes (maximum). In the illustrations presented alongside, it should be noted that:
- STI represents the cash component of short-term performance; and
- LTI represents the total share appreciation rights awards, bonus-matching awards, deferred bonus shares and company-matching shares
| CEO (R000) | Prescribed officers (average) (R000) |
 |
 |
| CFO (R000) | Other executives (average) (R000) |
 |
 |
EXECUTIVE SERVICE CONTRACTS
Senior executives are employed full-time under standard agreements, with a notice period of three months. We strive to bind all senior executives by a restraint-of-trade agreement. To the extent that executives have access to proprietary business insights and intellectual property, Tiger Brands will enforce the agreement should they join a competitor. The restraint comprises a three-month notice period or three months’ special leave (paid as a three-month lump sum (based on guaranteed package) on termination).
SIGN ON AND SPECIFIC RETENTION PAYMENTS
In exceptional circumstances (mainly for the recruitment and retention of critical and/or scarce talent), Tiger Brands will award a sign on/retention payment which will be subject to the following conditions:
Employees must remain in the service of Tiger Brands as a permanent employee for an uninterrupted period of 24 months from date of the payment. Should the employee or Tiger Brands decide to terminate the employment relationship for any reason, excluding those listed below, before the expiration of 24 months, the employee will be required to repay Tiger Brands the full gross amount. There will be no pro rata refunds. Should Tiger Brands terminate the employment relationship because of operational reasons (for example, retrenchment or redundancy) or ill health, or if termination occurs as a result of death, the employee will not be required to repay Tiger Brands the full gross amount.
Payments on termination of employment
| REMUNERATION POLICY COMPONENT | VOLUNTARY TERMINATION (IE RESIGNATION) |
INVOLUNTARY TERMINATION (RETRENCHMENT, RETIREMENT, DEATH) | ||
| Guaranteed package | Paid up to last day of service | Paid up to last day of service including notice period, where applicable. | ||
| Medical aid | Benefit continues to last day of service | Benefit continues up to last day of service. Employees who qualify for post-retirement medical aid funding will continue to receive the employer contribution with effect from their normal retirement date. | ||
| Retirement and risk plans | Employer contributions paid until last day of service. Employee is entitled to the value of the investment, but all risk benefits cease on termination of service. | |||
| Other benefits | Not applicable | Severance package in respect of retrenchments – one or two weeks for every completed year of service in terms of the relevant rules. | ||
| Short-term incentive | No pro rata bonus paid | Pro rata STI payment (based on extent of achieving specified financial and strategic targets for the period and a personal performance agreement being in place at the date of exit). | ||
| Long-term incentives | All unvested awards (other than certain deferred bonus shares) will be forfeited | Depending on the nature of the instrument and reasons for termination, a participant may retain all units or a pro rata portion. Accelerated vesting and settlement of retained units may apply in certain circumstances. | ||
EXTERNAL BOARD APPOINTMENTS
Tiger Brands encourages members of the executive committee to consider accepting appropriate opportunities to serve as non-executive directors on the main board or committees of external companies. We believe this encourages our executives to broaden their skills base and experience.
Under a formal policy, an executive is limited to one substantive outside directorship. The chairman of the Tiger Brands board, chairman of the nominations committee, and chairman of the remuneration committee are required to authorise these appointments based on a recommendation from the CEO. Other than in respect of their appointment to the boards of associate companies, directors’ fees under this policy may be retained by the individual. Other than associate companies, Tiger Brands currently has no executive members serving as non-executive directors on the main boards or committees of external companies. Details of executive committee members serving on the boards of associate companies appear herein.
Non-executive directors
Fees and approval process
Non-executive directors are paid an annual retainer that reflects their overall contribution and input to the company, and not just for attendance at board and committee meetings. Fees are reviewed annually, and increases are implemented in March after approval at the AGM. A bespoke survey is conducted every two years to benchmark these fees against South African companies listed on the JSE, based on market capitalisation, revenue, total assets and number of people. These are similar metrics to that of the benchmark group for executive directors and prescribed officers, but further expanded to include the diversity of skill and calibre required on the board or relevant committee. Companies comprising the peer group are detailed below:
| RCL Foods Limited | The Spar Group Ltd | MTN Group Ltd | ||
| Blue Label Telecoms Ltd | Clicks Group Ltd | Vodacom Group Ltd | ||
| Pioneer Food Group Ltd | Sappi Group | Standard Bank Group Ltd | ||
| Telkom SA SOC Ltd | Woolworths Holding Ltd | Datatec Ltd | ||
| Distell Group Ltd | Aspen Pharmacare Holdings Ltd | JD Group Ltd |
Targeted remuneration for FY19 was based on the 65th percentile of the peer group, which is in line with the revision of our internal anchor point. Non-resident non-executive directors are paid a premium in comparison to resident directors. The table below shows the range of the premium paid to non-resident non-executive directors across large JSE-listed organisations in various industries:
| Target position | Premium for non-resident non-executive directors | |
| Minimum | 72% | |
|---|---|---|
| Maximum | 296% | |
| Average | 171% | |
| Median | 155% |
The median for non-resident non-executive directors’ fees reflects a premium of 155% above resident director fees. Tiger Brands currently pays a premium of 130% for non-resident non-executive directors, which is below the market median. The chairman does not receive any additional remuneration for participating in committees of the board. Non-executive directors who perform services outside the scope of their ordinary duties will not receive additional remuneration. Shareholder approval will be sought for increasing non-executive directors’ fees, including fees paid for attending special board meetings. Details of proposed increases for FY20 appear in the notice of AGM of shareholders to be held on 18 February 2020. Details of non-executive directors’ fees paid in the review period appear below.
Voting statement
This remuneration policy is subject to a non-binding advisory vote by shareholders at the upcoming AGM.
Section 3: Implementation report
In this section of the remuneration report we explain the implementation of our remuneration policy, providing details of the remuneration paid to our executive directors, prescribed officers and senior management for the financial year ended 30 September 2019.
SALARY ADJUSTMENTS
The remuneration committee approved an overall guaranteed package salary increase budget of 5% for the period 1 December 2018 to 30 November 2019. This included executive management.
An additional budget was ringfenced and managed centrally to correct pay disparities.
2019 GUARANTEED PACKAGE
The following increases to guaranteed packages were implemented in the reporting period for executive directors and prescribed officers. New amounts were effective from 1 December 2018:
| 1 Dec 2018 to 30 Nov 2019 Rand |
1 Dec 2017 to 30 Nov 2018 Rand |
% increase | |||
|---|---|---|---|---|---|
| Executive directors | |||||
| LC Mac Dougall | 9 537 728 | 9 083 550 | 5% | ||
| NP Doyle | 6 877 238 | 6 549 750 | 5% | ||
| Prescribed officers | |||||
| PW Spies | 5 095 650 | 4 853 000 | 5% | ||
| Y Maharaj | 5 092 500 | 4 850 000 | 5% | ||
| PD Sithole | 5 097 331 | 4 549 157 | 12,1%* |
* PD Sithole was awarded a 12,1% increase to align remuneration with the market and that of his peers.
An average increase of 6% (2018: 6%) was awarded to executive directors and prescribed officers in comparison to an average increase of 5,32% (2018: 6%) for the rest of the company.
2019 SHORT-TERM INCENTIVE
As indicated in the policy section, the STI for executive directors and prescribed officers is based on the combination of a business performance component and personal performance component.
EXECUTIVE DIRECTORS
The business multiplier for executive directors is weighted according to the table below. Results for FY19 were as follows:
| Achievement | |||||||||
| Strategic objective |
Strategic objective weighting |
Key performance indicator | Key performance indicator weighting |
Threshold Score = 50% |
Target Score = 100% |
Stretch Score = 200% |
Actual result | Weighted result |
|
| Growth | 60% | Sales volume growth | 10% | 40,0% | 100,0% | 140,0% | <40% | – | |
| Absolute gross margin | 10% | 98,6% | 100,0% | 103,6% | <98,6% | – | |||
| PBIT | 40% | 98,6% | 100,0% | 103,6% | <98,6% | – | |||
| Efficiency | 10% | Cost-saving initiatives | 5% | 98,6% | 100,0% | 123,4% | 100% | – | |
| Net working capital | 5% | 101,2% | 100,0% | 97,7% | >101,2% | – | |||
| People and sustainability | 30% | Quality | Reduction in execution-related marketplace incidents yoy by |
>20% | – | ||||
| 10% | 10% | 15% | 20% | ||||||
| Safety (LTIFR) | 10% | 120,0% | 100,0% | 80,0% | <120% | – | |||
| Level 7 | Level 7 | Level 6 | Level 6 | ||||||
| BBBEE score | 10% | (60 to 61) | (61,1 to 65) | – | |||||
The targeted percentages for “threshold”, “target” and “stretch” as set out above per KPI represent the targeted percentage achievement of the underlying budgeted amounts.
Linear vesting will apply if the actual result falls between “threshold” and “target” or between “target” and “stretch”. Targets for the STI for 2018 and 2019 were not met, hence no STI was paid. Note for 2019, the EBIT threshold was not met to trigger payment of the STI. This is an overriding condition of the scheme. Therefore the weighted result for each KPI was zero in FY19.
For the review period, in addition to the financial targets above, the following KPIs as per the balanced scorecard applied to the CEO, CFO and prescribed officers. The level of achievement is reflected alongside each KPI in the table below.
The FY19 personal performance multiplier is the aggregated result of assessing the KPIs for the relevant executive, as follows:
Executive directors
The business multiplier for executive directors is weighted according to the table below. The results for FY19 were as follows:
| LC Mac Dougall | NP Doyle | |||||||||
| Key performance indicators | Not met | Partially met | Met | Exceeded | Not met | Partially met | Met | Exceeded | ||
| Top-tier financial results | ||||||||||
| Revenue | ||||||||||
| Gross margin | ||||||||||
| Cost savings | ||||||||||
| Return on net assets | ||||||||||
| Market performance | ||||||||||
| On-shelf availability | ||||||||||
| Innovation rate | ||||||||||
| Power in Mind (Brand Health)* | ||||||||||
| Compliance | ||||||||||
| Zero high level 1 audit findings | ||||||||||
| Reduction in consumer complaints | ||||||||||
| Safety (LTIFR) | ||||||||||
| BBBEE implementation | ||||||||||
| People | ||||||||||
| Improved employee engagement | ||||||||||
| Percentage of leadership positions filled internally | ||||||||||
| Diversity and inclusion | ||||||||||
| Individual KPIs | ||||||||||
* Brand Health is measured on an individual category and not on an aggregated basis.
| Name | GP* | On-target % | Actual group performance factor % |
Actual personal performance factor % |
2019 STI (Rand) |
2018 STI** (Rand) |
|||
| LC Mac Dougall | 9 537 728 | x | 60% | x | – | + | – | – | – |
| NP Doyle | 6 877 238 | x | 60% | x | – | + | – | – | – |
Prescribed officers
The business multiplier for the prescribed officers is weighted according to the table below. Results for FY19 were as follows:| Strategic objective |
Strategic objective weighting |
Key performance indicator | Key performance indicator weighting |
Threshold Score = 50% |
Target Score = 100% |
Stretch Score = 200% |
Achievement | ||
| Actual result |
Weighted result |
||||||||
| Growth | 60% | Sales volume growth | 10% | 40,0% | 100,0% | 140,0% | <40% | – | |
| Absolute gross margin | 10% | 98,6% | 100,0% | 103,6% | <98,6% | – | |||
| PBIT | 40% | 98,6% | 100,0% | 103,6% | <98,6% | – | |||
| Efficiency | 10% | Cost savings initiatives | 5% | 98,6% | 100,0% | 123,4% | 100% | – | |
| Net working capital | 5% | 101,2% | 100,0% | 97,7% | >101,2% | – | |||
| People and sustainability | 30% | Quality | 10% | Reduction in execution-related marketplace incidents yoy by |
>20% | – | |||
| 10% | 15% | 20% | |||||||
| Safety (LTIFR) | 10% | 120,0% | 100,0% | 80,0% | <120% | – | |||
| Level 7 | Level 7 | Level 6 | Level 6 | ||||||
| BBBEE score | 10% | (60 to 61) | (61.1 to 65) | – | |||||
The targeted percentages for “threshold”, “target” and “stretch” as set out above per key performance indicator represent the targeted percentage achievement of the underlying budgeted amounts.
Linear vesting will apply if the actual result falls between “threshold” and “target” or between “target” and “stretch”. Targets for the STI for 2018 and 2019 were not met, hence no STI was paid. Note for 2019, the EBIT threshold was not met to trigger payment of the STI. This is an overriding condition of the scheme. Therefore the weighted result for each KPI was zero in FY19.
| PW Spies | Y Maharaj | PD Sithole | |||||||||||||
| Key performance indicators | Not met | Partially met | Met | Exceeded | Not met | Partially met | Met | Exceeded | Not met | Partially met | Met | Exceeded | |||
| Top-tier financial results | |||||||||||||||
| Revenue | |||||||||||||||
| Gross margin | |||||||||||||||
| Cost savings | |||||||||||||||
| Return on net assets | |||||||||||||||
| Market performance | |||||||||||||||
| On-shelf availability | |||||||||||||||
| Innovation rate | |||||||||||||||
| Power in Mind (Brand Health)* | |||||||||||||||
| Compliance | |||||||||||||||
| Zero high level 1 audit findings | |||||||||||||||
| Reduction in consumer complaints | |||||||||||||||
| Safety (LTIFR) | |||||||||||||||
| BBBEE implementation | |||||||||||||||
| People | |||||||||||||||
| Improved employee engagement | |||||||||||||||
| Percentage of leadership positions filled internally | |||||||||||||||
| Diversity and inclusion | |||||||||||||||
| Individual KPIs | |||||||||||||||
* Brand Health is measured on an individual category and not on an aggregated basis.
No STI was awarded to prescribed officers as illustrated below:
| Name | GP* | On-target % | Actual group performance factor % |
Actual business unit performance factor % |
Actual personal performance factor % |
2019 STI (Rand) |
2018 STI** (Rand) |
||||
| P Spies | 5 095 650 | x | 50% | x | – | + | – | + | – | – | – |
| Y Maharaj | 5 092 500 | x | 50% | x | – | + | – | + | – | – | – |
| PD Sithole | 5 097 331 | x | 50% | x | – | + | – | + | – | – | – |
* Annual guaranteed package in rand as at 30 September 2019.
** Includes the value of bonus deferrals.
2019 LONG-TERM INCENTIVES
Long-term incentive awards made during the year to executive directors and prescribed officers are set out below:
| SARs | Bonus-matching shares | |||||||
| Name | PDT multiplier*** |
GP | Award % | Face value | Number | STI** | Award % | Face value |
| LC Mac Dougall* | 137,5% | 9 537 728 | 120% | 15 737 099 | 57 420 | – | 50% | – |
| NP Doyle* | 175,0% | 6 877 238 | 120% | 14 443 489 | 52 700 | – | 50% | – |
| Deferred bonus shares and company‑matching shares |
Expected value (based on fair value) | ||||||
| Name | Number | Match % | Face value | Number | SARS | Bonus-matching shares |
Deferred bonus shares and company- matching shares |
| LC Mac Dougall* | – | 100% | – | – | 4 721 130 | – | – |
| NP Doyle* | – | 100% | – | – | 4 333 047 | – | – |
| SARs | Bonus-matching shares | |||||||
| Name | PDT multiplier*** |
GP | Award % | Face value | Number | STI** | Award % | Face value |
| P Spies* | 125,0% | 5 095 650 | 110% | 7 007 970 | 25 570 | – | 50% | – |
| Y Maharaj* | 137,5% | 5 092 500 | 110% | 7 704 108 | 28 110 | – | 50% | – |
| PD Sithole* | 175,0% | 5 097 331 | 110% | 9 814 447 | 35 810 | – | 50% | – |
| Deferred bonus shares and company‑matching shares |
Expected value (based on fair value) | ||||||
| Name | Number | Match % | Face value | Number | SARS | Bonus-matching shares |
Deferred bonus shares and company- matching shares |
| P Spies* | – | 100% | – | – | 2 102 391 | – | – |
| Y Maharaj* | – | 100% | – | – | 2 311 232 | – | – |
| PD Sithole* | – | 100% | – | – | 2 944 334 | – | – |
| * | Allocated on 6 December 2018 at a VWAP of R274,07. |
| ** | STI in respect of the year ended 30 September 2018. |
| *** | A performance differentiation tool (PDT) is used to modify the standard quantum of SARs and bonus-matching shares, based on an individual’s personal performance, leadership and ability. This is a discretionary percentage ranging from 0% to 200%. |
Only share appreciation rights were awarded. Bonus-matching shares, deferred bonus shares and company-matching shares were not awarded to executive directors and prescribed officers in addition to Share Appreciation Rights as the STI targets were not met.
LTI AWARDS VESTING OR WITH A PERFORMANCE PERIOD ENDING IN 2019
The outcome for awards due to vest in FY19, and whose performance conditions ended by 30 September 2019, are shown below. This applies to all eligible participants.
| LTI measures | Performance condition result |
||
| LTI allocation | Total shareholder return |
Real HEPS growth |
(% vesting) |
| Company-matching shares granted in 2016 | N/A | N/A | 100% (time-based vesting) |
| Deferred bonus shares granted in 2016 | N/A | N/A | 100% (time-based vesting) |
| Bonus-matching shares granted in 2016 | N/A | N/A | 100% (time-based vesting) |
| Performance shares granted in 2016*# | 9 February 2016 – partially met, |
||
| and 24 May 2016 – not met | N/A | 37,5%/0% | |
| Share appreciation rights granted in 2014 – third tranche | N/A | 5% | |
| Share appreciation rights granted in 2015 – second tranche | N/A | – | |
| Share appreciation rights granted in 2016 – first tranche | N/A | – | |
* Performance conditions for awards made on 9 February 2016 partially met, but not met for awards made on 24 May 2016.
# The last allocation of performance shares was in May 2016.
| Met | Partially met | Not met |
Payments for termination of office
No additional payments were made for executives terminating office.
Compliance with remuneration policy
There were no deviations from the remuneration policy in the financial year.
SINGLE TOTAL FIGURE OF REMUNERATION
The following tables disclose total remuneration received and receivable by executive directors and prescribed officers for the period 1 October 2018 to 30 September 2019:
EXECUTIVE DIRECTORS
| LC Mac Dougall | NP Doyle | |||||
| Remuneration element | FY2019 R’000 |
FY2018 R’000 |
% | FY2019 R’000 |
FY2018 R’000 |
% |
| Basic salary | 8 973 398 | 8 511 653 | 5 831 685 | 5 497 977 | ||
|---|---|---|---|---|---|---|
| Retirement funding | 328 810 | 339 880 | 960 971 | 913 148 | ||
| Other benefits | 159 824 | 153 092 | 30 000 | 72 000 | ||
| Guaranteed package | 9 462 032 | 9 004 625 | 6 822 656 | 6 483 125 | ||
| Short-term incentive | – | – | – | – | ||
| Cash remuneration | 9 462 032 | 9 004 625 | 6 822 656 | 6 483 125 | ||
| SARs | – | – | 4 446 313 | – | ||
| Bonus-matching shares | – | – | – | – | ||
| Deferred bonus shares and company-matching shares | – | – | – | – | ||
| Total remuneration | 9 462 032 | 9 004 625 | 5,1 | 11 268 969 | 6 483 125 | 73,8 |
PRESCRIBED OFFICERS
| PW Spies | Y Maharaj | PD Sithole | |||||||
| Remuneration element | FY2019 R’000 |
FY2018 R’000 |
% | FY2019 R’000 |
FY2018* R’000 |
% | FY2019 R’000 |
FY2018 R’000 |
% |
| Basic salary | 4 354 374 | 4 029 942 | 4 347 451 | 1 021 587 | 4 547 133 | 3 988 160 | |||
|---|---|---|---|---|---|---|---|---|---|
| Retirement funding | 338 725 | 344 639 | 338 732 | 84 797 | 338 836 | 344 981 | |||
| Other benefits | 363 917 | 408 446 | 365 901 | 1 106 116 | 120 000 | 141 624 | |||
| Guaranteed package | 5 057 016 | 4 783 027 | 5 052 084 | 2 212 500 | 5 005 969 | 4 474 765 | |||
| Short-term incentive | – | – | – | – | – | – | |||
| Cash remuneration | 5 057 016 | 4 783 027 | 5 052 084 | 2 212 500 | 5 005 969 | 4 474 765 | |||
| SARs | – | – | – | – | 1 674 224 | – | |||
| Bonus-matching shares | – | – | – | – | – | – | |||
| Deferred bonus shares and company-matching shares | – | – | – | – | – | – | |||
| Total remuneration | 5 057 016 | 4 783 027 | 5,7 | 5 052 084 | 2 212 500 | 128,3 | 6 680 193 | 4 474 765 | 49,3 |
* Y Maharaj appointed 1 July 2018.
NUMBER AND VALUE OF LTI SHARE AWARDS
Disclosure of the quantum and value of awards for the CEO and CFO outstanding at the beginning and end of the reporting period, as well as new awards made in the period, are provided in the tables below, with the cash value of awards settled during the reporting period indicated in the value-based tables.
| Name and awards | Award date | Vesting date | Grant price at award ZAR |
Revised grant price due to Oceana unbundling*** |
Opening number |
Adjustment due to Oceana unbundling*** |
Granted during the year |
Adjustment due to Oceana unbundling*** |
| LC Mac Dougall | ||||||||
| 2016 Deferred bonus shares | 07/12/2016 | 07/12/2019 | – | – | 650 | 49,00 | – | – |
| 2016 Company-matching shares | 07/12/2016 | 07/12/2019 | – | – | 650 | 49,00 | – | – |
| 2016 Bonus-matching shares | 07/12/2016 | 07/12/2019 | – | – | 650 | 49,00 | – | – |
| 2016 Performance shares | 24/05/2016 | 24/05/2019 | – | – | 8 160 | 618,00 | – | – |
| 2016 SARS | 24/05/2016 | 24/05/2019 | 341,68 | 317,64 | 12 000 | – | – | – |
| 24/05/2020 | 341,68 | 317,64 | 12 000 | 908,00 | – | – | ||
| 24/05/2021 | 341,68 | 317,64 | 12 000 | 908,00 | – | – | ||
| 2016 SARS | 07/12/2016 | 07/12/2019 | 395,97 | 368,11 | 10 946 | 828,33 | – | – |
| 07/12/2020 | 395,97 | 368,11 | 10 947 | 828,33 | – | – | ||
| 07/12/2021 | 395,97 | 368,11 | 10 947 | 829,00 | – | – | ||
| 2017 SARS | 11/12/2017 | 11/12/2020 | 414,45 | 385,29 | 2 996 | 227,00 | – | – |
| 11/12/2021 | 414,45 | 385,29 | 2 997 | 227,00 | – | – | ||
| 11/12/2022 | 414,45 | 385,29 | 2 997 | 227,00 | – | – | ||
| 2018 SARS | 06/12/2018 | 06/12/2021 | 274,07 | 254,79 | – | – | 19 140 | 1 448,00 |
| 06/12/2022 | 274,07 | 254,79 | – | – | 19 140 | 1 448,00 | ||
| 06/12/2023 | 274,07 | 254,79 | – | – | 19 140 | 1 448,00 | ||
| Total | 87 940 | 5 748 | 57 420 | 4 344 | ||||
| NP Doyle | ||||||||
| 2015 Company-matching shares | 03/12/2015 | 03/12/2018 | – | – | 2 688 | – | – | – |
| 2015 Deferred bonus shares | 03/12/2015 | 03/12/2018 | – | – | 2 688 | – | – | – |
| 2016 Company-matching shares | 07/12/2016 | 07/12/2019 | – | – | 1 060 | 80,00 | – | – |
| 2016 Deferred bonus shares | 07/12/2016 | 07/12/2019 | – | – | 1 060 | 80,00 | – | – |
| 2015 Bonus-matching shares | 04/02/2015 | 04/02/2018* | – | – | 2 320 | – | – | – |
| 2016 Bonus-matching shares | 09/02/2016 | 09/02/2019 | – | – | 1 330 | – | – | – |
| 2016 Bonus-matching shares | 07/12/2016 | 07/12/2019 | – | – | 1 590 | 120,00 | – | – |
| 2015 Performance shares | 04/02/2015 | 04/02/2018* | – | – | 4 358 | – | – | – |
| 2016 Performance shares | 09/02/2016 | 09/02/2019 | – | – | 5 720 | – | – | – |
| 2012 Phantom cash share options | 02/07/2012 | 02/07/2015** | 252,01 | – | 5 000 | – | – | – |
| 02/07/2016** | 252,01 | – | 5 000 | – | – | – | ||
| 02/07/2017** | 252,01 | – | 5 000 | – | – | – | ||
| 2013 Phantom cash share options | 13/02/2013 | 13/02/2016 | 299,83 | – | 5 000 | – | – | – |
| 13/02/2017 | 299,83 | – | 5 000 | – | – | – | ||
| 13/02/2018* | 299,83 | – | 5 000 | – | – | – | ||
| 2014 SARs | 28/02/2014 | 28/02/2017 | 254,45 | 236,55 | 6 067 | 459,00 | – | – |
| 28/02/2018* | 254,45 | 236,55 | 6 067 | 459,00 | – | – | ||
| 28/02/2019 | 254,45 | 236,55 | 6 066 | 23,00 | – | – | ||
| 2015 SARs | 04/02/2015 | 04/02/2018* | 385,33 | 358,22 | 1 038 | 79,00 | – | – |
| 04/02/2019 | 385,33 | 358,22 | 3 847 | 291,00 | – | – | ||
| 04/02/2020 | 385,33 | 358,22 | 3 847 | – | – | – | ||
| 2016 SARs | 09/02/2016 | 09/02/2019 | 291,71 | 271,19 | 7 623 | – | – | – |
| 09/02/2020 | 291,71 | 271,19 | 7 623 | 577,00 | – | – | ||
| 09/02/2021 | 291,71 | 271,19 | 7 624 | 577,00 | – | – | ||
| 2016 SARs | 07/12/2016 | 07/12/2019 | 395,97 | 368,11 | 11 260 | 852,00 | – | – |
| 07/12/2020 | 395,97 | 368,11 | 11 260 | 852,00 | – | – | ||
| 07/12/2021 | 395,97 | 368,11 | 11 260 | 852,00 | – | – | ||
| 2017 SARs | 11/12/2017 | 11/12/2020 | 414,45 | 385,29 | 15 276 | 1 156,00 | – | – |
| 11/12/2021 | 414,45 | 385,29 | 15 277 | 1 156,00 | – | – | ||
| 11/12/2022 | 414,45 | 385,29 | 15 277 | 1 156,00 | – | – | ||
| 2018 SARs | 06/12/2018 | 06/12/2021 | 274,07 | 254,79 | – | – | 17 566 | 1 329,00 |
| 06/12/2022 | 274,07 | 254,79 | – | – | 17 567 | 1 329,00 | ||
| 06/12/2023 | 274,07 | 254,79 | – | – | 17 567 | 1 330,00 | ||
| Total | 182 226 | 8 769 | 52 700 | 3 988 |
| Name and awards | Forfeited during the year |
Performance condition achieved |
Settled during the year |
Closing number |
Face value at award ZAR |
Cash received ZAR |
Value of shares acquired ZAR |
Closing fair value vesting ZAR |
| LC Mac Dougall | ||||||||
| 2016 Deferred bonus shares | – | – | – | 699 | 257 308,89 | – | – | 146 803,98 |
| 2016 Company-matching shares | – | – | – | 699 | 257 308,89 | – | – | 146 803,98 |
| 2016 Bonus-matching shares | – | – | – | 699 | 257 308,89 | – | – | 146 803,98 |
| 2016 Performance shares | 8 778 | – | – | – | – | – | – | – |
| 2016 SARS | 12 000 | – | – | – | – | – | – | – |
| – | – | – | 12 908 | 4 100 097,12 | – | – | 113 461,32 | |
| – | – | – | 12 908 | 4 100 097,12 | – | – | 159 671,96 | |
| 2016 SARS | – | – | – | 11 774 | 4 334 249,84 | – | – | 79 947,72 |
| – | – | – | 11 775 | 4 334 617,95 | – | – | 90 787,82 | |
| – | – | – | 11 776 | 4 334 863,36 | – | – | 92 794,88 | |
| 2017 SARS | – | – | – | 3 223 | 1 241 789,67 | – | – | 24 430,34 |
| – | – | – | 3 224 | 1 242 174,96 | – | – | 30 015,44 | |
| – | – | – | 3 224 | 1 242 174,96 | – | – | 44 168,80 | |
| 2018 SARS | – | – | – | 20 588 | 5 245 616,52 | – | – | 734 579,84 |
| – | – | – | 20 588 | 5 245 616,52 | – | – | 823 520,00 | |
| – | – | – | 20 588 | 5 245 616,52 | – | – | 888 578,08 | |
| Total | 20 778 | – | – | 134 674 | 41 438 841 | – | – | 3 522 368 |
| NP Doyle | ||||||||
| 2015 Company-matching shares | – | – | 2 688 | – | – | 497 243 | 231 323 | – |
| 2015 Deferred bonus shares | – | – | 2 688 | – | – | 497 512 | 231 050 | – |
| 2016 Company-matching shares | – | – | – | 1 140 | 419 645,40 | – | – | 239 422,80 |
| 2016 Deferred bonus shares | – | – | – | 1 140 | 419 645,40 | – | – | 239 422,80 |
| 2015 Bonus-matching shares | – | – | 2 320 | – | – | 429 411,36 | 199 407 | – |
| 2016 Bonus-matching shares | – | – | 1 330 | – | – | 161 916,00 | 190 634 | – |
| 2016 Bonus-matching shares | – | – | – | 1 710 | 629 468,10 | – | – | 359 134,20 |
| 2015 Performance shares | – | – | 4 358 | – | – | 806 396,16 | 374 808 | – |
| 2016 Performance shares | 3 575 | – | 2 145 | – | – | 261 214,00 | 307 371 | – |
| 2012 Phantom cash share options | – | – | 5 000 | – | – | 89 950 | – | – |
| – | – | 5 000 | – | – | 89 950 | – | – | |
| – | – | 5 000 | – | – | 89 950 | – | – | |
| 2013 Phantom cash share options | 5 000 | – | – | – | – | – | – | – |
| 5 000 | – | – | – | – | – | – | – | |
| 5 000 | – | – | – | – | – | – | – | |
| 2014 SARs | – | – | – | 6 526 | 1 543 725,30 | – | – | 18 077,02 |
| – | – | – | 6 526 | 1 543 725,30 | – | – | 18 077,02 | |
| 5 766 | – | – | 323 | 76 405,65 | – | – | 894,71 | |
| 2015 SARs | – | – | – | 1 117 | 400 131,74 | – | – | 793,07 |
| – | – | – | 4 138 | 1 482 314,36 | – | – | 2 937,98 | |
| 3 847 | – | – | – | – | – | – | – | |
| 2016 SARs | 7 623 | – | – | – | – | – | – | – |
| – | – | – | 8 200 | 2 223 758,00 | – | – | 76 014,00 | |
| – | – | – | 8 201 | 2 224 029,19 | – | – | 146 797,90 | |
| 2016 SARs | – | – | – | 12 112 | 4 458 548,32 | – | – | 82 240,48 |
| – | – | – | 12 112 | 4 458 548,32 | – | – | 93 383,52 | |
| – | – | – | 12 112 | 4 458 548,32 | – | – | 95 442,56 | |
| 2017 SARs | – | – | – | 16 432 | 6 331 085,28 | – | – | 124 554,56 |
| – | – | – | 16 433 | 6 331 470,57 | – | – | 152 991,23 | |
| – | – | – | 16 433 | 6 331 470,57 | – | – | 225 132,10 | |
| 2018 SARs | – | – | – | 18 895 | 4 814 257,05 | – | – | 674 173,60 |
| – | – | – | 18 896 | 4 814 511,84 | – | – | 755 840,00 | |
| – | – | – | 18 897 | 4 814 766,63 | – | – | 815 594,52 | |
| Total | 35 811 | – | 30 529 | 181 343 | 57 776 055 | 2 923 542 | 1 534 593 | 4 120 924 |
| * | Vesting date and, where applicable, settlement of shares extended as a consequence of the voluntary closed period. |
| ** | Lapsing of shares extended as a consequence of closed period. Shares should have been exercised by 02/07/2018. |
| *** | Tiger Brands implemented the unbundling of its investment in Oceana Group Limited on 29 April 2019. Shareholders were notified that participants in the Tiger Brands 2013 Share Plan will be placed in a position which is as close as possible to the position they would have been in, had the unbundling not taken place. |
Consequently, the number of instruments that had been awarded in terms of the rules of the plan were increased by 7,5679% and the strike prices applicable to SARs were reduced by 7,035%.
INTERESTS OF DIRECTORS AND PRESCRIBED OFFICERS IN BBBEE SCHEMES
No executive director or prescribed officer, was granted shares in terms of the Black Managers Trust (BMT) Scheme.
Non-executive directors’ remuneration 2019
The non-executive director remuneration paid for the year ended 30 September 2019 is disclosed below, excluding VAT in rand:| Committee | MO Ajukwu | MJ Bowman | MP Fandeso | CH Fernandez | GA Klintworth | M Makanjee | TE Mashilwane |
| Notes | 4 | 2 | |||||
| Board fees | 938 898 | 408 216 | 104 543 | 209 086 | 938 898 | 408 216 | 408 216 |
| Audit committee fees | 207 382 | 133 619 | – | 93 426 | – | – | 314 782 |
| Investment committee fees | – | 38 418 | – | – | – | – | – |
| Remuneration committee, nomination and governance committee fees | – | 225 390 | – | – | – | 103 586 | – |
| Social, ethics and transformation committee fees | – | – | – | – | 113 236 | 188 730 | – |
| Risk and sustainability committee fees | 334 080 | – | 109 636 | – | – | 145 252 | |
| Extraordinary fees | 50 837 | – | 22 103 | 22 103 | 50 837 | 22 103 | 22 103 |
| Ad hoc work/meetings | – | – | – | – | – | – | 8 334 |
| Total FY19 | 1 531 197 | 805 643 | 126 646 | 434 251 | 1 102 971 | 722 635 | 898 687 |
| Total FY18 | 1 208 332 | 647 384 | – | – | 229 000 | 683 284 | 555 884 |
| Committee | KD Mokhele | RD Nisbet | MP Nyama | YGH Suleman | BS Tshabalala | DG Wilson |
| Notes | 1 | 3 | ||||
| Board fees | 1 895 752 | – | 408 216 | 99 565 | – | 104 543 |
| Audit committee fees | – | – | – | 43 453 | – | 46 712 |
| Investment committee fees | – | – | – | 10 417 | – | 8 792 |
| Remuneration committee, nomination and | ||||||
| governance committee fees | – | – | 49 920 | – | – | 13 416* |
| Social, ethics and transformation | ||||||
| committee fees | – | – | 94 820 | – | – | – |
| Risk and sustainability committee fees | – | – | 74 050 | 70 155 | – | – |
| Extraordinary fees | 22 103 | – | 22 103 | – | – | 22 103 |
| Ad hoc work/meetings | – | – | – | 8 334 | – | – |
| Total FY19 | 1 917 855 | – | 649 109 | 231 924 | – | 195 566 |
| Total FY18 | 1 805 504 | 873 012 | 572 598 | 876 207 | 525 362 | – |
* Member of the remuneration committee only.
1. YGH Suleman resigned on 22 November 2018.
2. CH Fernandez appointed on 1 March 2019.
3. DG Wilson appointed on 1 June 2019.
4. MP Fandeso appointed on 1 July 2019.
NON-EXECUTIVE DIRECTORS’ REMUNERATION FY20
The following table reflects the proposed fees from 1 March 2020, excluding VAT, subject to the approval of shareholders at the AGM on 18 February 2020:
| Forum | Capacity | Current rate effective March 2019 |
Proposed rate resident board members – effective March 2020 |
Proposed fees to be paid to non-resident board members – effective March 2020 |
| Main board | Chairman | 1 941 990 | 2 077 929 | * |
| Member | 418 173 | 435 000 | 1 000 500 | |
| Audit | Chairman | 326 890 | 344 869 | * |
| Member | 186 851 | 194 325 | * | |
| Remuneration and nominations | Chairman | 229 810 | 245 897 | * |
| Member | 107 331 | 114 844 | * | |
| Risk and sustainability | Chairman | 290 443 | 302 061 | * |
| Member | 148 100 | 154 024 | 354 255 | |
| Social, ethics and transformation | Chairman | 195 111 | 202 915 | * |
| Member | 98 467 | 103 883 | 238 930 | |
| Hourly fees* | 4 396 | 4 572 | 10 516 | |
| Extraordinary meetings** | 22 103 | 22 987 | 52 870 |
* Hourly fees are for the sole purpose of the calculation of fees for the investment committee meetings which are held on an ad hoc basis.
** Payment of fees for extraordinary meetings are at the discretion of the chairman of the board and chairman of the remuneration committee.
NON-BINDING ADVISORY VOTE
This implementation report is subject to a non-binding advisory vote by shareholders at the AGM on 18 February 2020.