
Shareholders info
Analysis of registered shareholders and company schemes
Registered shareholder spread
In accordance with the JSE Listings Requirements, the following table confirms the spread of registered shareholders as detailed in the annual report and accounts dated 28 September 2018 was:
| Shareholder spread |
Number
of holders |
% of total shareholders |
Number
of shares |
% of share issued capital |
||||
| 1 – 1 000 shares | 14 810 | 82,2 | 3 567 489 | 1,9 | ||||
| 1 001 – 10 000 shares | 2 457 | 13,6 | 7 654 392 | 4,0 | ||||
| 10 001 – 100 000 shares | 560 | 3,1 | 16 957 268 | 8,9 | ||||
| 100 001 – 1 000 000 shares | 152 | 0,9 | 48 458 164 | 25,5 | ||||
| 1 000 001 shares and above | 31 | 0,2 | 113 181 613 | 59,7 | ||||
| Total | 18 010 | 100,00 | 189 818 926 | 100,00 | ||||
Public and non-public shareholdings
Within the shareholder base, we are able to confirm the split between public shareholdings and directors/company-related schemes as being:
| Shareholder type | Number of holders |
% of total shareholders | Number of shares |
% of share issued capital |
||||
| Non-public shareholders | 10 | 0,06 | 24 447 455 | 12,9 | ||||
| Empowerment holdings | 6 | 0,03 | 13 897 716 | 7,4 | ||||
| Own holding | 1 | 0,01 | 10 326 758 | 5,4 | ||||
| Share trusts | 2 | 0,01 | 218 031 | 0,1 | ||||
| Directors and associates | 1 | 0,01 | 4 950 | 0,00 | ||||
| Public shareholders | 18 000 | 99,94 | 165 371 471 | 87,1 | ||||
| Total | 18 010 | 100,00 | 189 818 926 | 100,00 | ||||
Substantial investment management and beneficial interests above 3%
Through regular analysis of STRATE registered holdings, and pursuant to the provisions of section 56 of the Companies Act, the following shareholders held directly and indirectly equal to or in excess of 3% of the issued share capital as at 28 September 2018:
Investment management shareholdings
| Investment manager | Total shareholding |
% | ||
| PIC | 21 941 167 | 11,6 | ||
| Colonial First State Global Asset Management | 16 237 136 | 8,6 | ||
| Janus Henderson Investors | 13 286 954 | 7,0 | ||
| Coronation Asset Management Proprietary Limited | 7 113 954 | 3,7 | ||
| BlackRock Inc | 6 821 587 | 3,6 | ||
| The Vanguard Group Inc | 6 026 117 | 3,2 | ||
| Total | 71 426 915 | 37,7 | ||
| Beneficial shareholdings | Total shareholding |
% | ||
| Government Employees Pension Fund (PIC) | 24 362 021 | 12,8 | ||
| Tiger Consumer Brands Limited | 10 326 758 | 5,5 | ||
| Tiger Brands Foundation SPV | 9 068 067 | 4,8 | ||
| Stewart Investors Global Emerging Markets Leaders Fund | 7 569 525 | 4,0 | ||
| Total | 51 326 371 | 27,1 |
| Geographic split of investment managers and company-related holdings |
Geographic split of beneficial shareholders | |
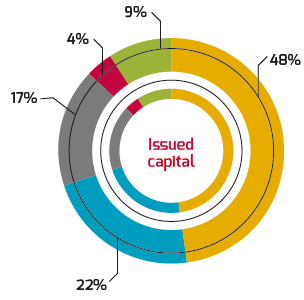 |
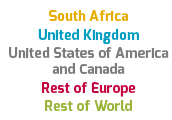 |
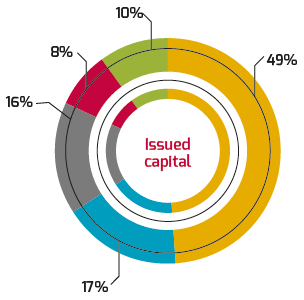 |