


 42 / 202

38
Tiger Brands Limited integrated annual report
2015
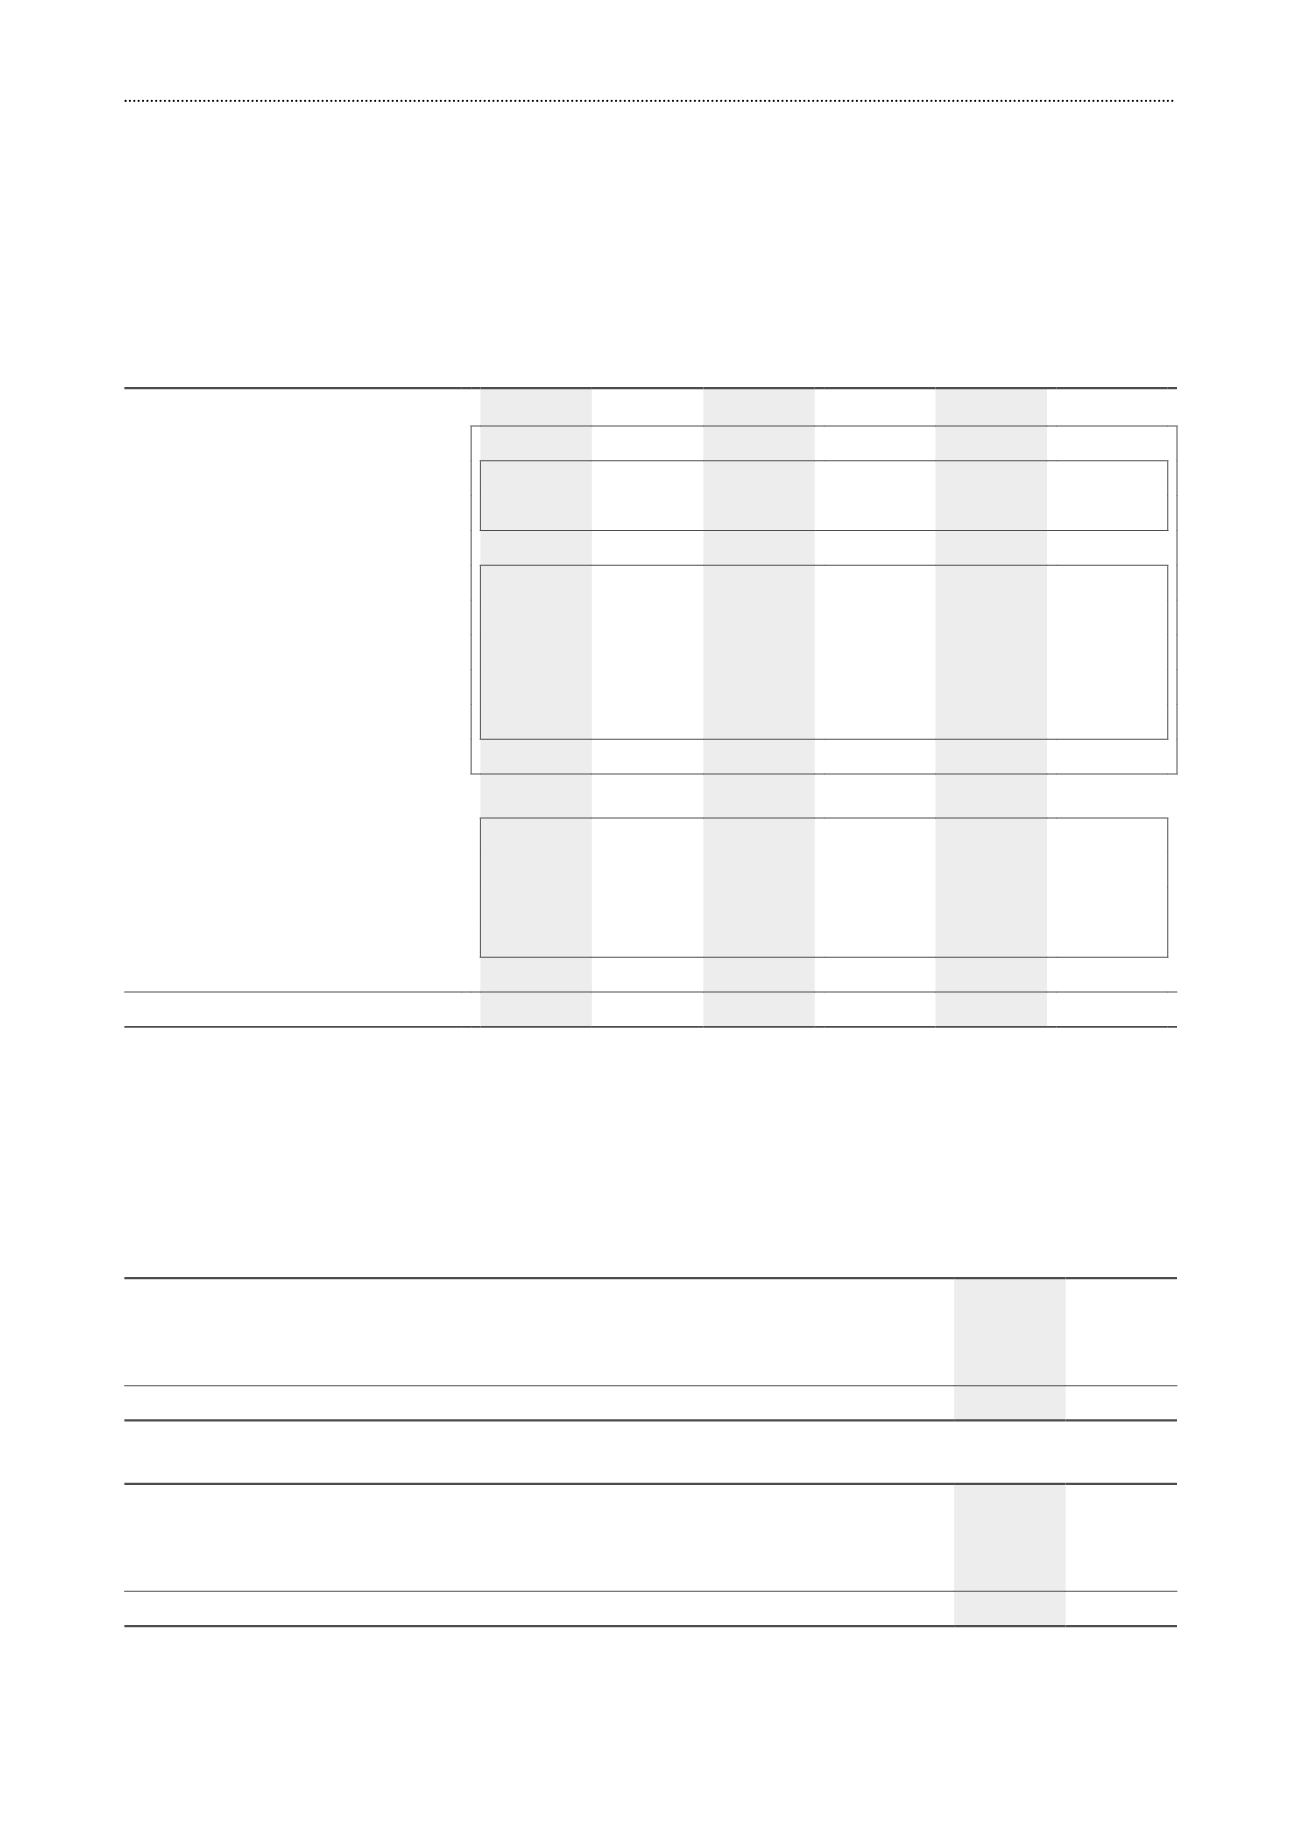
Total assets
Accounts payable,
provisions and accruals
and taxation
Capital expenditure
Rm
2015
Restated*
2014
2015
Restated*
2014
2015
Restated*
2014
Domestic operations
17 654,1
15 715,2
3 731,8
3 693,3
520,3
636,4
Grains
4 649,7
4 981,1
1 301,1
1 117,4
148,0
108,3
Milling and Baking
1
3 222,6
3 845,4
924,8
847,2
133,5
103,8
Other Grains
2
1 427,1
1 135,7
376,3
270,2
14,5
4,5
Consumer Brands
9 312,5
9 553,1
2 091,3
1 960,5
280,4
454,7
Groceries
4 115,8
4 156,1
834,4
769,6
146,3
276,7
Snacks & Treats
895,6
1 086,7
365,7
382,6
37,4
133,2
Beverages
1 989,6
1 668,5
225,8
218,0
15,2
15,2
Value Added Meat Products
811,6
1 151,9
257,6
237,2
34,3
20,8
HPCB
1 499,9
1 489,9
407,8
353,1
47,2
8,8
Other
3
3 691,9
1 181,0
339,4
615,4
91,9
73,4
Exports and International*
5 468,8
5 162,6
713,7
705,1
209,1
206,0
Exports
2 899,4
2 752,8
191,4
178,6
83,8
50,6
International operations – Central Africa*
638,8
588,1
231,7
211,5
52,5
25,8
International operations – Eastern Africa*
824,5
891,5
74,1
106,6
29,8
33,6
Deciduous Fruit
1 106,1
930,1
216,5
208,4
43,0
96,0
Nigeria
1 680,9
3 667,3
948,0
951,4
152,2
140,5
Total
24 803,8
24 545,1
5 393,5
5 349,8
881,6
982,9
*
Segmental reporting has been revised during the current year, with International operations being further segmented into Central and East Africa
operations. The comparative disclosures have been restated accordingly.
1
Comprises maize milling, wheat milling and baking, sorghum beverages and malt-based breakfast cereals.
2
Comprises rice, pasta and oat-based breakfast cereals.
3
Includes the corporate office.
Total assets
Rm
2015
2014
Split of non-current assets
South Africa
5 139,4
5 962,0
Outside South Africa
3 734,8
4 432,3
Total
8 874,2
10 394,3
Rm
2015
2014
Reconciliation of total assets
Total assets per statements of financial position
24 854,3
24 852,0
Deferred taxation asset
(50,5)
(306,9)
24 803,8
24 545,1
Segment report
continued
for the year ended 30 September 2015